Sine training
### Sine training example for ffnet ###

from ffnet import ffnet
from math import pi, sin, cos

# Let's define network connectivity by hand:
conec = [(1, 2), (1, 3), (1, 4), (1, 5), (2, 6), (3, 6), (4, 6), (5, 6), \
         (0, 2), (0, 3), (0, 4), (0, 5), (0, 6)]
# Note 1: Biases in ffnet are handled as the connections
#         from special node numbered 0. Input nodes cannot be biased.
# Note 2: Node numbering and order of links in conec is meaningless,
#         but the connections have to be from source to target.
# Note 3: The same connectivity can be obtained using mlgraph function
#         provided with ffnet (layered architecture (1,4,1)).

# Network creation
net = ffnet(conec)

# Generation of training data (sine values for x from 0 to 2*pi)
patterns = 16
input = [ [ 0. ] ] + [ [ k*2*pi/patterns ] for k in xrange(1, patterns + 1) ]
target = [ [ sin(x[0]) ] for x in input ]

# Training network
#first find good starting point with genetic algorithm (not necessary, but may be helpful)
print "FINDING STARTING WEIGHTS WITH GENETIC ALGORITHM..."
net.train_genetic(input, target, individuals=20, generations=500)
#then train with scipy tnc optimizer
print "TRAINING NETWORK..."
net.train_tnc(input, target, maxfun = 5000, messages=1)

# Testing network
print
print "TESTNG NETWORK..."
output, regression = net.test(input, target, iprint = 2)

#################
# Make some plots
try:
    from pylab import *
    points = 128
    xaxis = [ 0. ] + [ k*2*pi/points for k in xrange(1, points + 1) ]
    sine = [ sin(x) for x in xaxis ]
    cosine = [ cos(x) for x in xaxis ]
    netsine = [ net([x])[0] for x in xaxis]
    netcosine = [ net.derivative([x])[0][0] for x in xaxis ]

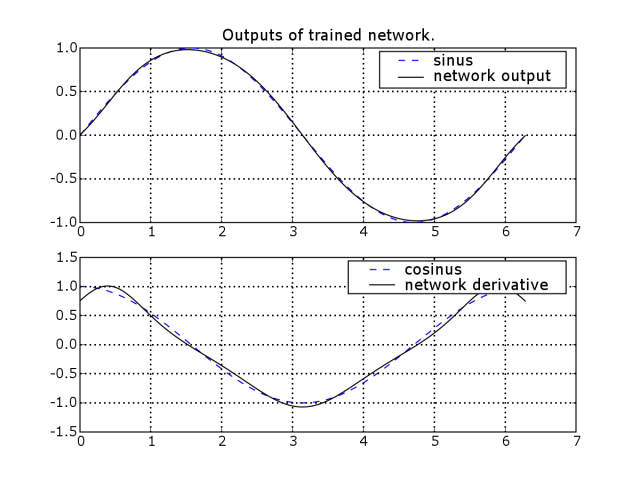
    subplot(211)
    plot(xaxis, sine, 'b--', xaxis, netsine, 'k-')
    legend(('sine', 'network output'))
    grid(True)
    title('Outputs of trained network.')

    subplot(212)
    plot(xaxis, cosine, 'b--', xaxis, netcosine, 'k-')
    legend(('cosine', 'network derivative'))
    grid(True)
    show()
except ImportError:
    print "Cannot make plots. For plotting install matplotlib..."
This script should produce an image like this:

