Pattern recognition
### Digits recognition example for ffnet ###
# Training file (data/ocr.dat) contains 68 patterns - first 58
# are used for training and last 10 are used for testing.
# Each pattern contains 64 inputs which define 8x8 bitmap of
# the digit and last 10 numbers are the targets (10 targets for 10 digits).
# Layered network architecture is used here: (64, 10, 10, 10).
from ffnet import ffnet, mlgraph, readdata
# Generate standard layered network architecture and create network
conec = mlgraph((64,10,10,10))
net = ffnet(conec)
# Read data file
print "READING DATA..."
data = readdata( 'data/ocr.dat', delimiter = ' ' )
input = data[:, :64] #first 64 columns - bitmap definition
target = data[:, 64:] #the rest - 10 columns for 10 digits
# Train network with scipy tnc optimizer - 58 lines used for training
print "TRAINING NETWORK..."
net.train_tnc(input[:58], target[:58], maxfun = 2000, messages=1)
# Test network - remaining 10 lines used for testing
print
print "TESTING NETWORK..."
output, regression = net.test(input[58:], target[58:], iprint = 2)
############################################################
# Make a plot of a chosen digit along with the network guess
try:
from pylab import *
from random import randint
digitpat = randint(58, 67) #Choose testing pattern to plot
subplot(211)
imshow(input[digitpat].reshape(8,8), interpolation = 'nearest')
subplot(212)
N = 10 # number of digits / network outputs
ind = arange(N) # the x locations for the groups
width = 0.35 # the width of the bars
bar(ind, net(input[digitpat]), width, color='b') #make a plot
xticks(ind+width/2., ('1', '2', '3', '4', '5', '6', '7', '8', '9', '0'))
xlim(-width,N-width)
axhline(linewidth=1, color='black')
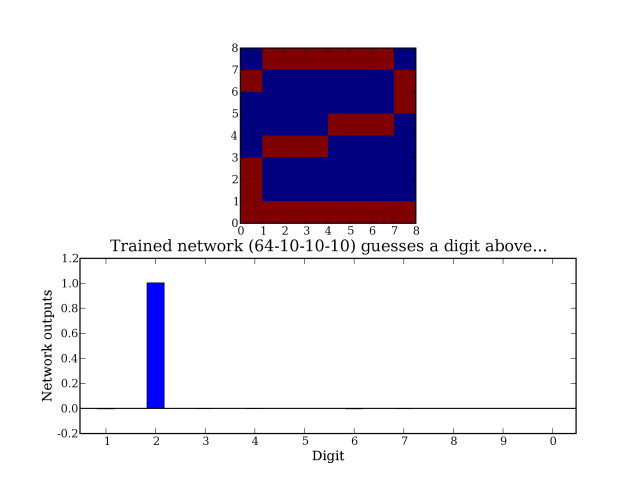
title("Trained network (64-10-10-10) guesses a digit above...")
xlabel("Digit")
ylabel("Network outputs")
show()
except ImportError, e:
print "Cannot make plots. For plotting install matplotlib.\n%s" % e
This script should produce an image like this: